As a part of Descriptive Statistics, in the previous blog we looked at what are the basic descriptive statistics that one can start with. This blog extends that idea further to explore the data in hand and get a more detailed picture. The basic descriptive statistics are the central tendency (mean, median, modes, etc.), the distribution of data (last blog talked about normal distribution, but data may not always follow the normal curve) and the dispersion of the data. Now, what forms the part of EDA is basically exploring what is your data about and what you can expect to extract or infer out of that data.
EDA can be uni-variate as well as multivariate. Basically, the aim is to get acquainted with the idiosyncrasies of every variable you have. All the kinds of analysis we do are nothing but running some statistical computing commands in R or similar tools to understand what has been a general trend shown by a variable when it is all by itself and when it is a part of some group of variables. It’s like observing how your cousin behaved when he was alone and when he was with his friends or relatives. Thus, our aim is not to build any statistical model while performing EDA but just to see if it is ready or the kind of statistical modelling we aim to do.
Let’s discuss the objectives of EDA first and then talk about the methods to do so.
Objectives:
Now, suppose that you noticed an irritated behavior of your cousin when he was in a group. This is like an observed phenomena and EDA’s objective is to suggest a hypothesis that this odd behaviors could be because your cousin was with some relatives rather than his friends. And may be, if you plan to draw an inference ‘cousin behaves like stupid’, you are then aware of the fact that this odd behavior is only when the person is with relatives.
Thus, the objectives of EDA are to suggest hypothesis for the causation of observed behaviors. It also aims to assess the assumptions on which we shall base our statistical inferences. When we know the data well enough we shall also be able to grasp which are right statistical tools and techniques for such a data and if there is something missing, then it can point out a need for further data collection through experiments or surveys.
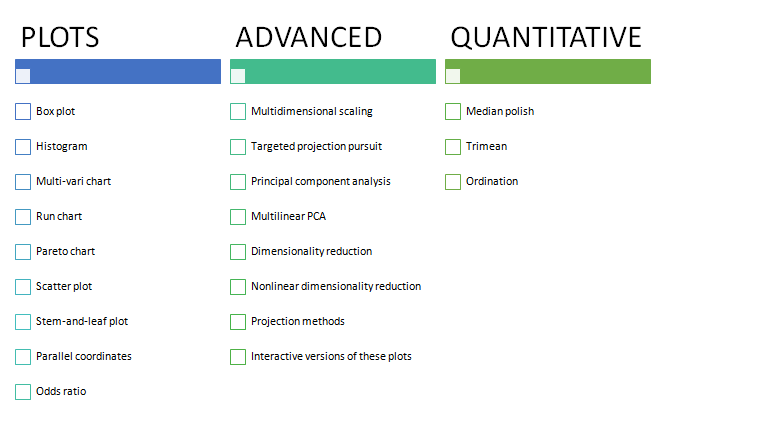
Techniques:

Often, through all these plots and advanced or quantitative analysis, one may notice flaws in the data or some extra information than we expected. Flaws could be missing data under certain scenarios and some extra information could be like that data is not for just one kind but maybe there are hidden clusters in the data and only one of the clusters is sensible for your analysis and so on. EDA, thus, opens door towards new possibilities and hypothesis.

