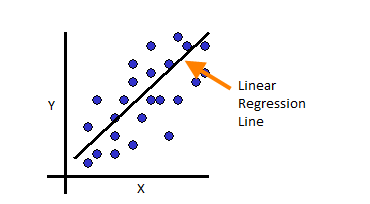
I, recently, read a blog from Harvard Business Review, which mentioned that linear regression is the business world’s most preferred technique for establishing relationship between variables. Apparently, it is the basic tool to predict future outcomes. As we understand, linear regression is all about predicting a value of a variable (dependent variable) based on other variables (independent variables). However, beyond this stepping stone, there are many steps involved in between which determine if the designed linear regression model is sensible or is irrelevant to real life problem that we are trying to solve.
To check if the linear regression model is relevant to the business problem, we may need to understand the business domain or consult with domain expert. Apart from business understanding there are some important parameters in this model that should be analyzed before using it on new observations and predicting outcomes.

The perfectness of a linear model is often judged by the model’s high R-Squared value. Determining quality of a model, just based on the value of R-Squared is actually like qualifying a linear model as good or bad on the basis of incomplete assessment. There are several other factors that need to be considered while assessing a linear predictive model.
Linear Regression, as we know has an intercept and a slope value. This same slope and coefficient value is used to fit an outcome for every observation in the data set. The fitted line that we are trying to draw using this coefficient and slope is bound to deviate from actual observations as slope and intercept co-efficient is constant throughout. This causes some error called residual. Residual is nothing but distance between actual observation and observation achieved through our linear regression model.
There is always some random noise in the system and hence certain percentage of R-Squared is lost owing to noise. Noise is a random component hence linear model cannot fit entirely through it. Thus, if we have to define R-Squared, it is the measure in percentage of how well the independent variables used in the model explain the linear regression model. R-Squared value thus for a model should be high but we should take note that there is noise as well and if R-Squared is too high then may be unnecessary independent variables were used in modeling which are trying to fit a line according to some random noise. In such cases the R-Squared is high but model fails to predict appropriately when ran on unknown new set of observations. Hence, along with high R-Squared value, to test a linear regression model, analyzing a residual plot becomes essential. Ideally, the residual plot should reflect a random distribution. If the linear model designed has some independent variables which are giving high R-Squared value but are not really contributing to a good predictive model, then the model must be, at times, under fitting or over fitting values. This under or over fit pattern can be confirmed through residual plots.
Apart from looking at R-Squared and Residual plots, there are terms like F-test, Adjusted R-Squared and Predicted R-Squared. One must take a look at F-test value which talks about the overall statistical significance of the relationship between the model and the dependent variable. F-test is a formal hypothesis test for such relationship.
Not always a linearly fitted line passes through every data point. We may add some higher order polynomials to bend or twist the fitted line. This again increases the R-Squared value and can be really tempting. But then there is a caveat with R-Squared that as one goes on adding elements to the model, its value goes on increasing as the model tries to fit line through random noise. Such condition is called as over fitting the model and has reduced ability to predict. Under such circumstances, it is best to take a look at Adjusted R-Squared value along with R-Squared value. Adjusted R-Squared is always less than R-Squared and it is modified version of usual R-Squared such that the value of Adjusted one increases only if a newly added term is improving the linear model.
Also, one must check the Predicted R-Squared value to ensure that the model is good enough on the new observations. Predicted R-Squared is also always lower than R-Squared as, if the R-Squared is high for fitting random noise by any chance, Predicted R-Squared would fail to predict such a noise for new observations.
In conclusion, for a Linear Regression Model, one must ensure understanding business problem, identify significant variables, check for R-Squared value, F-test, Adjusted R-Squared as well as Predicted R-Squared values to determine if the model is good or bad.


Nicely explained!
Thank you Nikhil!